四、六级图表作文简介
1. 图表作文简介
图表作文历来被认为是一种相对高级的写作形式,主要测试考生是否具备观察、解释、说明或者描述图表所包含的信息和数据。图表作文在四、六级考试开始几年出现过数次,可后来整整十年中只出现过一次。直至2002年6月又重新出现。但在2003年6月四、六级作文分题后,六级考试连续两次考查了图表作文。同时在雅思考试中,对于学术类考生而言,图表作文是一种重要的学术技能考核。可以预计,这种类型在考试中出现的机会仍然较大。
在四级考试中有时要求写一篇短文,描述一个或几个图表,至少要写120~150字,时间为30分钟。我们先来看一看图表作文的类型。
2. 图表作文的类型
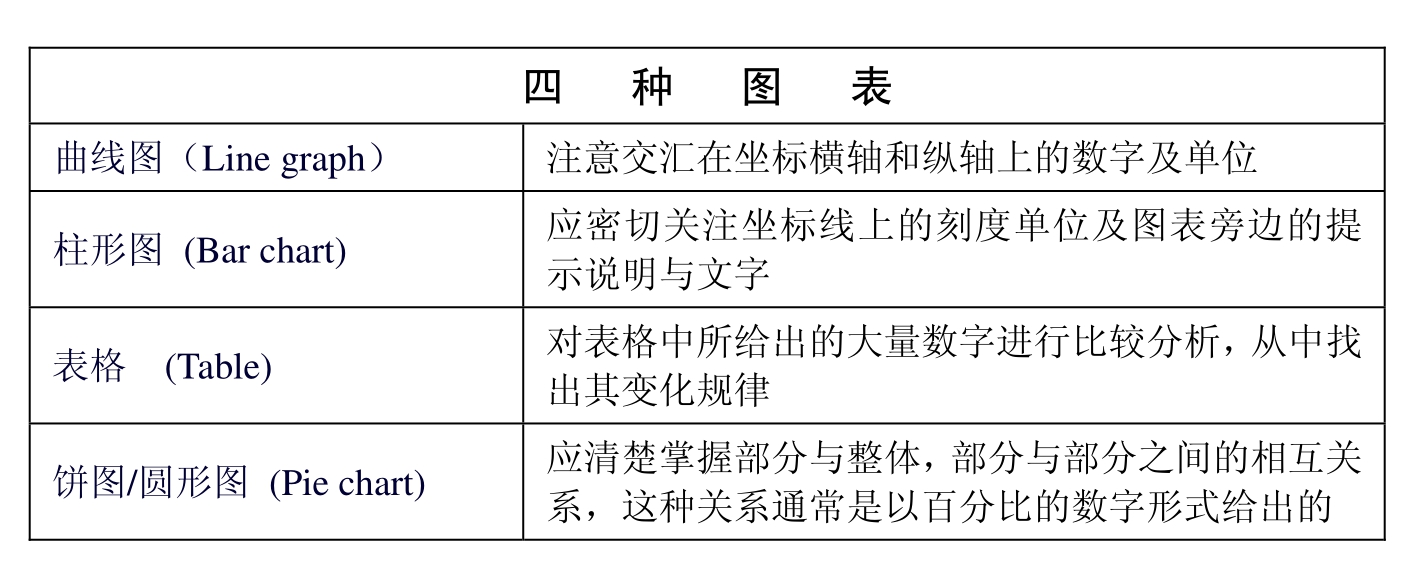
写此类作文时,首先要以题目中的要求(requirements)为指导,审慎解读图表,准确把握图表传递的信息,将其扩展成文。
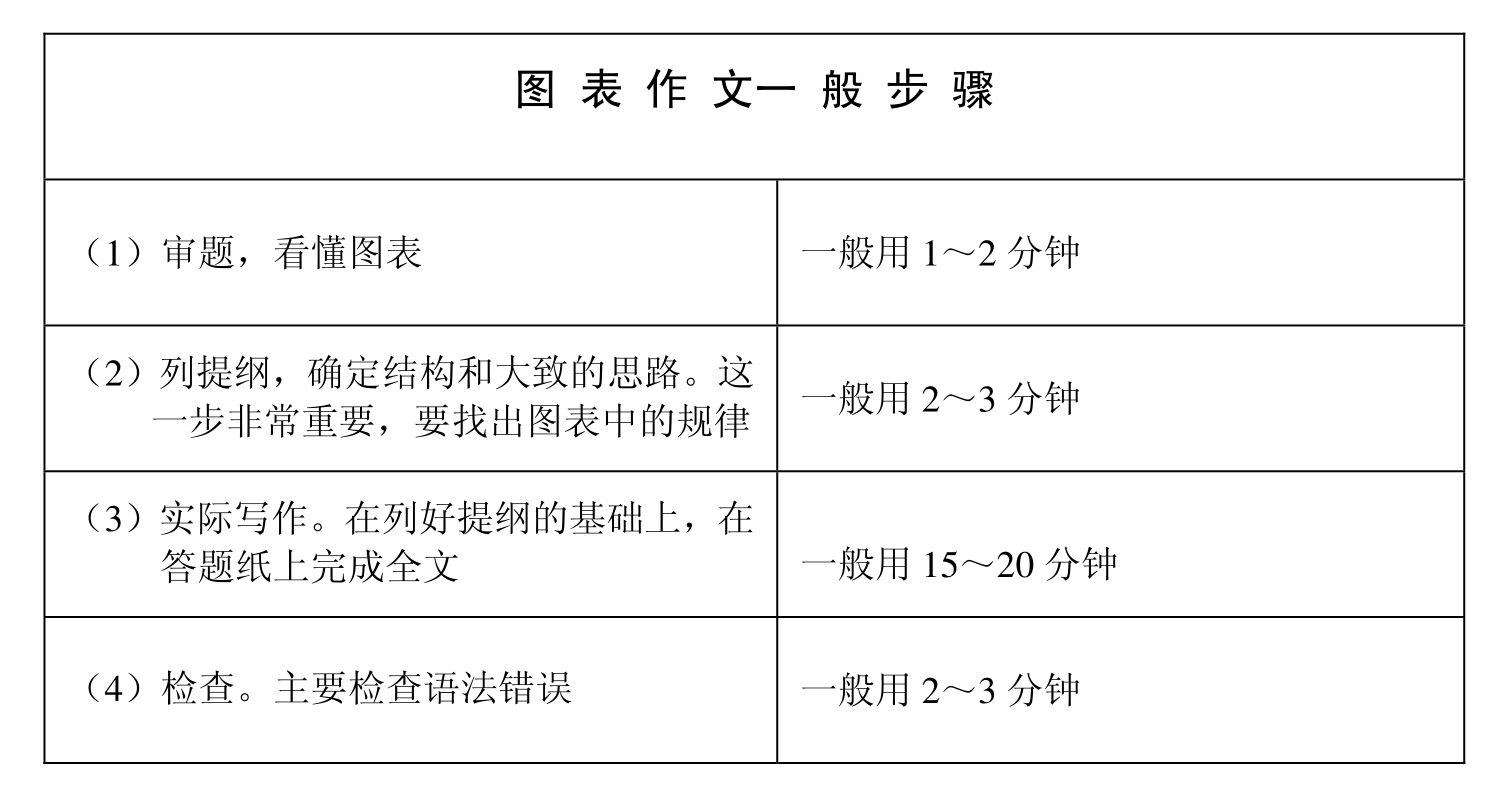
3. 图表作文的写作步骤
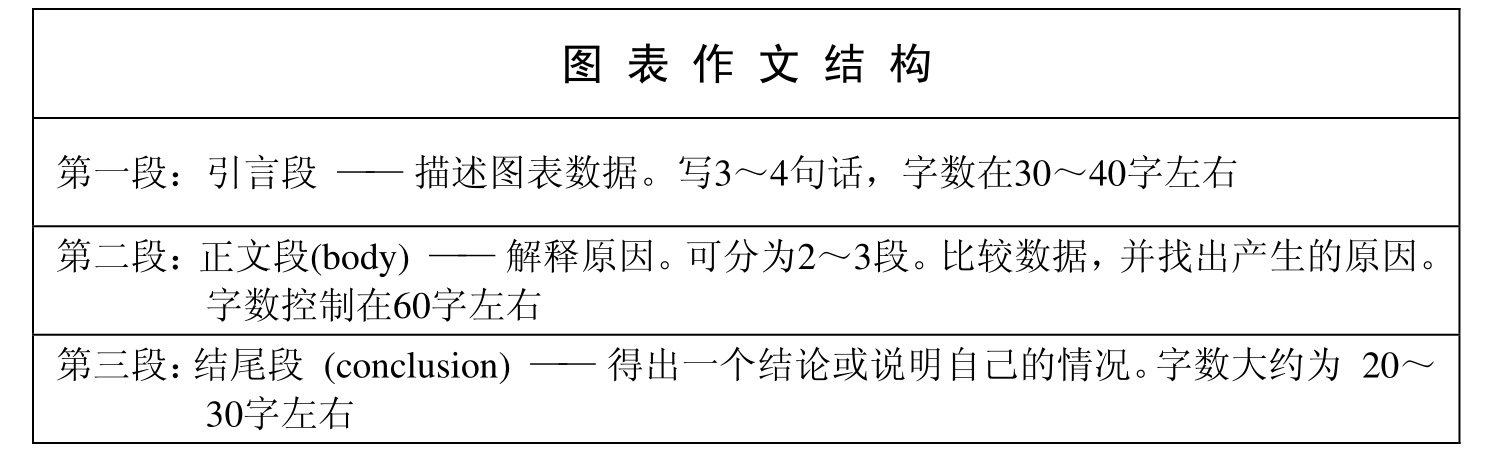
4. 图表作文的结构
四、六级图表作文一般写两到三段。
下面是一些引言的例子:
 There were many significant changes in modes of transport used by city dwellers from 1950 to 1990.
 The two pie charts show the proportion of males and females in employment in 6 broad categories, divided into manual and non-manual occupations.
 The two pie charts show the proportion of males and females arrested and the bar chart shows reasons why they were arrested.
The table shows consumer preferences in four different European countries.
下面是一些主体段的例子:
As can be seen, the USA — an industrialized country — had the highest GNP and daily calorie intake, the longest life expectancy and the lowest infant mortality rate.
It is clear that females at the NIH earn significantly less money than males with differences in salaries ranging between $197 and $ 9121.
However, it must be noted that there are only seven women in this position.
The biggest difference in numbers for any one position is in the position of investigator with a Ph.D.
By comparing fruit sugar, cane sugar and honey, we find that cane sugar lowers a Ph.D levels for the longest period, thus producing the greatest risk of the three.
下面是一些结论的例子:
The data suggest that the increased presence of women in the paid work force has not yet to lead to an increased role for men in the home.
In conclusion, the two charts clearly show that women do not have the same access as men to certain types of employment.
It appears that women are either more law-abiding than men or that law enforcement officers are more reluctant to arrest women.
In summary, we can see that both government policy and market forces affected the area devoted to grain production.
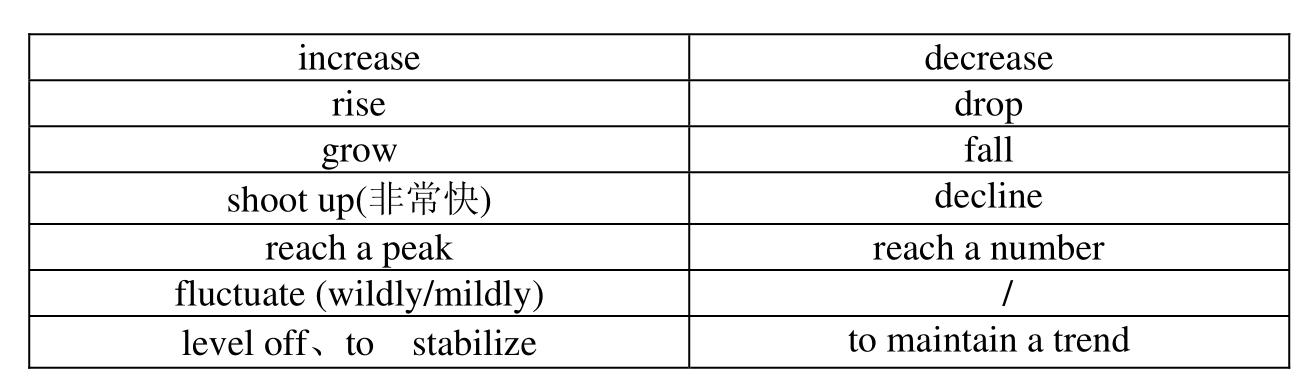
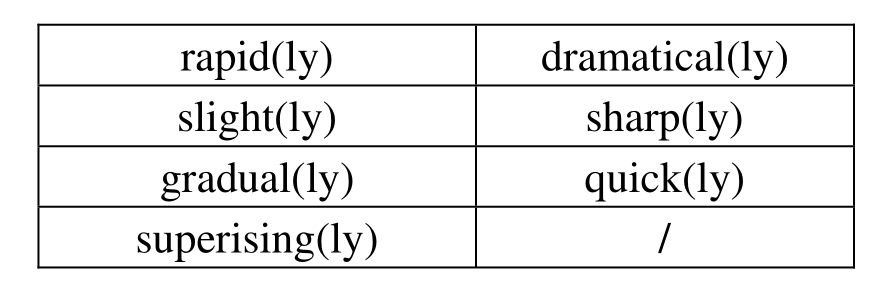
5. 图表的表示方法与变化、起伏的相关动词以及表达快慢的形容词或副词
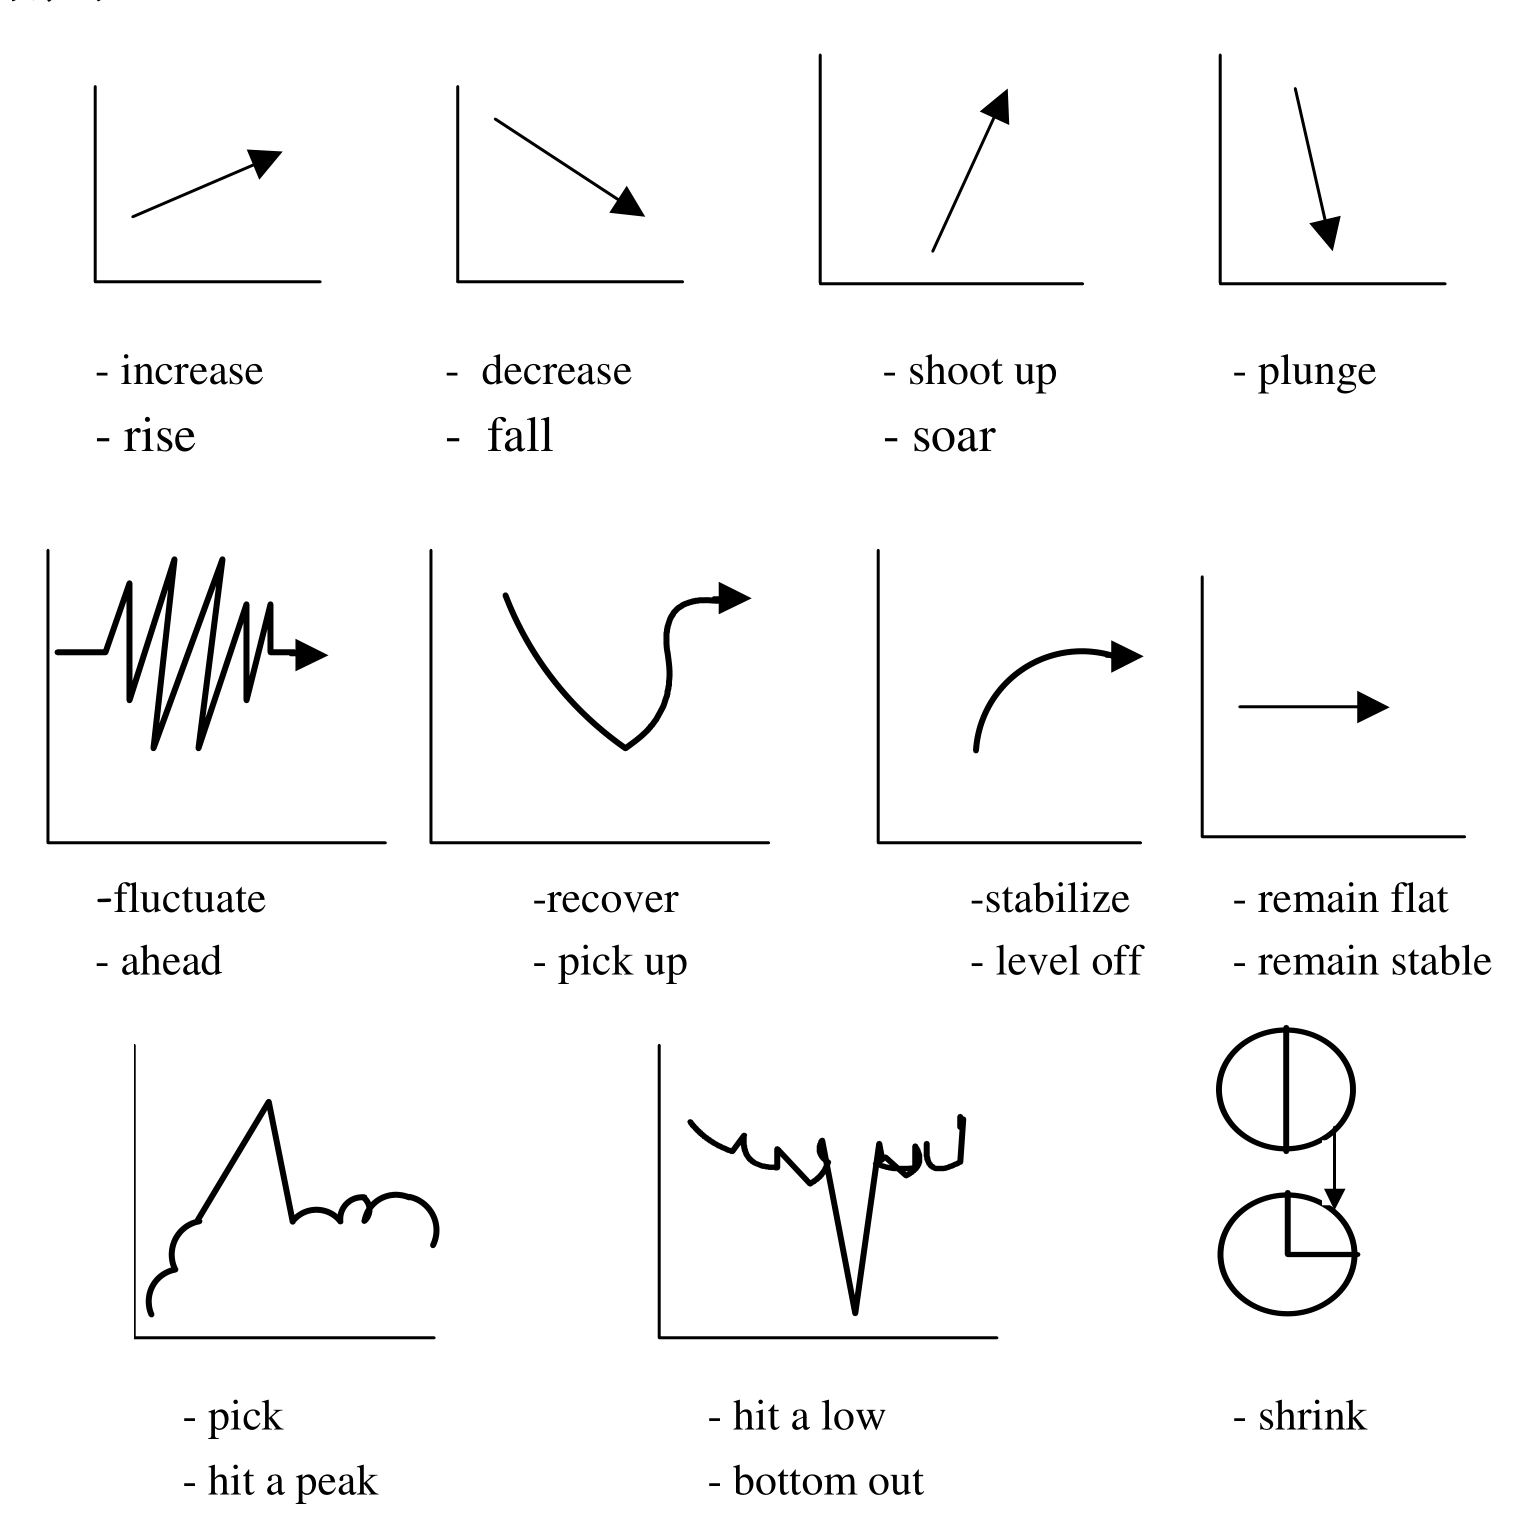
6. 变化、起伏相关的动词
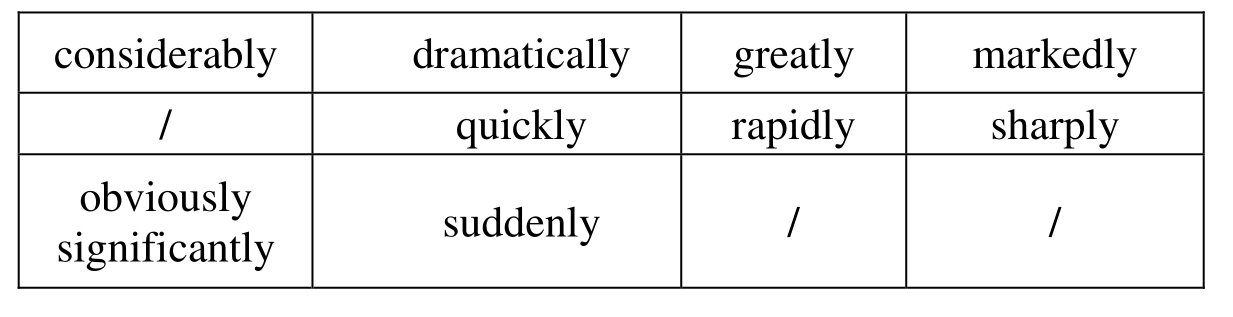
表达快慢的形容词或副词:
7. 表示数据的词汇
一般:have 10%; at 10%; over 10%
最高(低)点:peak; reach a peak/high(point); bottom out; reach the bottom
8. 表示程度的副词
1)程度较大:
2)程度较小:
![]()
9. 表示先下降后上升的句型
…fell before … began to make a recovery …
…continue the recovery, climbing to …
…dropped during …but increased again in …
…fell and then pick up during …
…collapsed before rising to … at the end of …
10. 对于百分比进行描述所使用的句型
…% the …is/has/have/are …
…accounts for …% of the total
…takes up …% in the whole chart
11. 趋势的比较

1) 表示相似的句型 (实例):
Both share prices rose sharply in January.
Neither company has made a profit yet.
Like X, Y fell in June.
X rose just as sharply as Y.
2) 表示差异的句型(实例):
X fell sharply whereas/while Y remained steady.
X fell quickly compared to Y.
Unlike Y, X rose by 10%.
X rose far more dramatically than Y.
3) 表示倍数的句型:
the … doubled/tripled in … compared with those in …
4) 客观比较的句型:
… is … in contrast to …
12. 数据的修饰
1) 表示不足的词或词组:
![]()
2) 表示超过的词或词组:
![]()
13. 另外一些有用的词
而:while however whereas on the other hand actually/in fact
相比:by contract on the contrary likewise compared with
最高点:the highest the top the summit the peak the most
最低点:bottom less least rock bottom
平均:mean average
趋势:tendency trend inclination
预见:prediction
达到顶峰:mount to
在……中占:… gain the percentage of
有一个稳定的过程:a stable period can be seen
14. 经典套句

1) The table shows … the changes in the number of ... over the period from ... to ...
该表格描述了在……年之……年间……数量的变化。
2) The bar chart illustrates that ...
该柱状图展示了……
3) The graph provides some interesting data regarding ...
该图为我们提供了有关……有趣数据。
4) The pie graph depicts (that) ...
该圆形图揭示了……
5) This is a cure graph, which describes the trend of ...
这个曲线图描述了……的趋势。
6) The figures/statistics show … (that) ...
数据(字)表明……
7) The tree diagram reveals how ...
该竖型图向我们揭示了如何……
8) The data/statistics show (that) ...
该数据(字)可以这样理解……
9) The data/statistics/figures lead us to the conclusion that ...
这些数据资料令我们得出结论……
10) As is shown/demonstrated/exhibited in the diagram /graph /chart/ table ...
如图所示……
11) According to the chart/figures ...
根据这些表(数字)……
12) As is shown in the table ...
如表格所示……
13) As can be seen from the diagram, … great changes have taken place in.
从图中可以看出,……发生了巨大变化。
14) From the table / chart / diagram / figure, we can see clearly that ... or it is clear / apparent from the chart that ...
从图表我们可以很清楚(明显)看到……
15) This is a graph, which illustrates ...
这个图表向我们展示了……
16) This table shows the changing proportion of a & b from ... to ...
该表格描述了……年到……年间a与b的比例关系。
17) The graph, presented in a pie chart, shows the general trend in.
该图以圆形的形式描述了……总的趋势。
18) This is a column chart showing ...
这是个柱型图,描述了……
19) As can be seen from the graph, the two curves show the fluctuation of...
如图所示,两条曲线描述了……的波动情况。
20) Over the period from ... to ... the ... remained level.
在……至……期间,……基本不变。
21) In the year between ... and.
在……年到……期间……
22) In the 3 years spanning from 1995 through 1998 ...
1995年至1998年的三年里……
23) From then on/from this time onwards ...
从那时起……
24) The number of ... remained steady/stable from (month/year) to (month/year).
……月(年)至……月(年)……的数量基本不变。
25) The number sharply went up to ...
数字急剧上升至……
26) The percentage of ... stayed the same between ... and.
……至……期间……的比率维持不变。
27) the figures peaked at ... in(month/year)
……的数目在……月(年)达到顶点,为……
28) The percentage remained steady at ...
比率维持在……
29) The percentage of ... is slightly larger / smaller than that of ...
……的比例比……的比例略高(低)。
30) There is not a great deal of difference between ... and.
……与……的区别不大。
31) The graphs show a threefold increase in the number of ...
该图表表明……的数目增长了三倍。
32) ... decreased year by year while ... increased steadily.
……逐年减少,而……逐步上升。
33) The situation reached a peak (a high point at) of (%).
……的情况(局势)到达顶(高)点,为……百分点。
34) The figures reached the bottom/a low point/hit a trough.
数字(情况)达到底部(低谷)。
35) A is ... times as much/many as b.
a是b的……倍。

36) A increased by ...
a增长了……
37) A increased to ...
a增长到……
38) High/low/great/small/ percentage.
比高(低)
39) There is an upward trend in the number of ...
……数字呈上升趋势。
40) A considerable increase/decrease occurred from ... to ...
……到……发生急剧上升。
41) From ... to ... the rate of decrease slow down.
从……到……,下降速率减慢。
42) From this year on,there was a gradual declined reduction in the. Reaching a figure of ...
从这年起,……逐渐下降至……
43) Be similar to ...
与……相似
44) Be the same as ...
与……相同
45) There are a lot similarities/differences between ... and.
……与……之间有许多相似(不同)之处
46) The difference between a and b lies in.
a与b之间的差别在于……
47) ... (Year) witnessed/saw a sharp rise in.
……年……急剧上升
免责声明:以上内容源自网络,版权归原作者所有,如有侵犯您的原创版权请告知,我们将尽快删除相关内容。